


ICCA 2025 Rankings Reveal Global Trends in International Association Meetings: Japan Leads Asia-Pacific with 77 Host Cities
The 2025 edition of ICCA’s Business Analytics Country and City Rankings Report provides valuable insight into both the current state and future direction of the global MICE industry. Published annually by the International Congress and Convention Association (ICCA), the report is regarded as one of the most influential benchmarks for international association meetings worldwide.
In this article, the MICE TIMES ONLINE editorial team examines key findings from the report’s 114 pages of data and analysis, highlighting the trends that are shaping the global meetings industry. Particular attention is given to the rapid growth seen across the Asia-Pacific region and to the performance of Japanese cities within the international rankings.
In addition to the published data, some statistics have been independently compiled and analyzed by the editorial team to provide a more detailed look at Japan’s position in the global meetings landscape.
This article explores the true value that international meetings bring to host destinations, as well as emerging priorities such as sustainability, providing insights that are essential for future urban development and destination strategy planning.
Note: This article was prepared by the MICE TIMES ONLINE editorial team based on information from the ICCA GlobeWatch: Business Analytics – Country & City Rankings 2025 report provided to the press by ICCA, with additional analysis and commentary from the editorial team.

ICCA CEO Highlights Industry Recovery and the Creation of Long-Term Value
In the introduction to the 2025 report, ICCA CEO Senthil Gopinath emphasizes that the latest findings demonstrate the resilience and continued recovery of the global meetings industry.
The report is based on information from more than 12,438 international and regional association meetings submitted by ICCA members worldwide and verified by a dedicated research team. Beyond serving as a historical record of meeting activity, the publication is intended to function as a practical resource that helps members make informed decisions and identify future business opportunities. It is also designed to provide evidence-based support for government policy development and private-sector investment.
International meetings generate immediate economic benefits through hotel stays, dining, transportation, and other visitor spending. However, according to Gopinath, their true value extends far beyond short-term economic impact. International conferences contribute to scientific advancement, policy development, knowledge exchange, and the creation of long-lasting international partnerships, leaving a broader societal legacy for host destinations.
Gopinath also notes that the inclusion of 162 countries and territories and 1,603 cities in the rankings reflects the ambition and engagement of the global meetings community. By documenting where meetings were held around the world during the previous year, the report provides one of the industry’s most important reference points for future destination selection and strategic planning.
About ICCA
The International Congress and Convention Association (ICCA) is a global community and knowledge hub for the international association meetings industry. Established in 1963, ICCA specializes in the international association and governmental meetings sector, providing access to industry data, educational resources, communication channels, business development opportunities, and professional networking platforms.
Today, ICCA is widely recognized as one of the leading organizations in the international meetings industry and plays an active role in supporting its continued development. Through initiatives such as the ICCA Association Community, the organization provides associations around the world with education, networking opportunities, tools, and resources designed to help them organize more effective and successful meetings.
By leveraging ICCA’s global network of member suppliers and industry partners, associations can access expertise and support across a wide range of destinations and meeting formats.
Source: ICCA Letter

Global Trends Reveal Structural Shifts in the Meetings Market
Europe Maintains the Largest Share of International Meetings, While Asia-Pacific Accounts for Approximately 22%
According to the 2025 data, Europe remained the dominant region for international association meetings, accounting for 53% of all events worldwide. The Asia-Pacific region followed with 22%, while North America represented 10% of the total.
Latin America accounted for 9%, followed by Africa at 4% and the Middle East at 2%. These figures illustrate the global distribution of knowledge exchange and professional collaboration facilitated through face-to-face meetings and conferences.
Meeting Size: Nearly 90% of Events Host Fewer Than 1,000 Participants, While Large Conventions Continue to Rebound
Analysis of meeting size shows that nearly 90% of all international meetings were attended by fewer than 1,000 participants. However, the data also highlights the resilience of large-scale events.
Meetings with more than 1,000 attendees have returned to, or exceeded, 2019 levels. In particular, major international conventions attracting more than 3,000 participants have fully recovered, demonstrating that large-scale gatherings remain one of the most durable and resilient formats within the global meetings industry.
Meeting Topics: Medicine Remains the Largest Sector, Followed by Technology and Science
The subject matter of international meetings also provides insight into global priorities and emerging trends.
Medical meetings ranked first with 2,688 events, followed by technology with 2,363 meetings and science with 2,038. Other major categories included education (1,052), industry (969), social sciences (777), management (701), economics (650), transportation and communications (540), and culture and ideas (507).
One of the most notable developments was the rapid growth of meetings focused on security and library and information science. In 2025, 208 meetings were held in the security field and 168 in library and information science.
While these categories remain relatively small in absolute terms, both have expanded dramatically since 2021, recording growth of approximately 3.9 times over the period. This trend reflects the increasing importance organizations and institutions place on information governance, cybersecurity, knowledge management, and risk mitigation.
The continued growth of meetings related to artificial intelligence is another significant trend identified in the report.
Over the past decade, AI-focused conferences have increased steadily, reaching a record high of 79 meetings in 2024. In 2025, the total remained elevated at 76 meetings, indicating sustained global interest in the field.
Historically, emerging technologies have often followed a pattern in which academic research reaches maturity before widespread commercial adoption begins. In the case of artificial intelligence, however, academic research and market adoption are advancing simultaneously, accelerating both innovation and practical implementation.
The report suggests that monitoring conference activity in fields such as quantum computing, synthetic biology, and climate engineering may provide valuable clues about the economic and technological priorities that will shape the coming decade.
Global Country and City Rankings Highlight Regional Strengths and Competitive Positioning
Top 20 Countries by Number of International Association Meetings
| Rank | Country/Territory | Meetings |
|---|---|---|
| 1 | United States | 792 |
| 2 | Italy | 616 |
| 3 | Germany | 565 |
| 4 | Spain | 544 |
| 5 | United Kingdom | 502 |
| 6 | Japan | 491 |
| 7 | France | 476 |
| 8 | Portugal | 356 |
| 9 | Netherlands | 330 |
| 10 | China | 326 |
| 11 | Canada | 312 |
| 12 | South Korea | 286 |
| 13 | Brazil | 276 |
| 14 | Australia | 241 |
| 14 | Belgium | 241 |
| 16 | Austria | 239 |
| 17 | Sweden | 227 |
| 18 | Poland | 215 |
| 19 | Denmark | 204 |
| 19 | Greece | 204 |
United States Remains Number One, While Japan Climbs from Eighth to Sixth Place
The 2025 country rankings show that the United States retained its position as the world’s leading destination for international association meetings, hosting 792 qualifying events. Italy ranked second with 616 meetings, followed by Germany in third place with 565. Spain ranked fourth with 544 meetings, while the United Kingdom completed the top five with 502.
Japan hosted 491 international association meetings in 2025, securing sixth place globally. This represents a significant improvement from its eighth-place ranking in 2019 and highlights the country’s continued growth and competitiveness within the international meetings market.
The rankings suggest that Japan has not only recovered from the disruptions of recent years but has also strengthened its position among the world’s leading meeting destinations. The result further reinforces Japan’s status as the highest-ranked country in the Asia-Pacific region.
Another notable development was the rise of Brazil, which hosted 276 meetings and ranked thirteenth globally. Brazil has exceeded its pre-2020 meeting volume by a considerable margin, making it one of the strongest growth stories in the rankings. Its performance also reflects the growing international profile of Latin America as a destination for association meetings and conferences.
City Rankings
| Rank | City | Meetings |
|---|---|---|
| 1 | Lisbon | 188 |
| 2 | Paris | 174 |
| 3 | Barcelona | 166 |
| 4 | Vienna | 159 |
| 5 | Singapore | 156 |
| 6 | Prague | 133 |
| 7 | Copenhagen | 131 |
| 8 | London | 124 |
| 9 | Seoul | 121 |
| 10 | Tokyo | 119 |
| 11 | Bangkok | 118 |
| 12 | Berlin | 112 |
| 13 | Madrid | 108 |
| 14 | Brussels | 105 |
| 15 | Hong Kong | 102 |
| 16 | Rome | 101 |
| 17 | Athens | 100 |
| 18 | Dublin | 95 |
| 18 | Istanbul | 95 |
| 20 | Amsterdam | 91 |
| 20 | Buenos Aires | 91 |
Looking at the global city rankings, Lisbon claimed the top position with 188 international association meetings. Paris followed in second place with 174 meetings, while Barcelona ranked third with 166.
Fourth place went to Vienna with 159 meetings, followed closely by Singapore in fifth place with 156. Prague ranked sixth with 133 meetings, ahead of Copenhagen with 131. London placed eighth with 124 meetings, while Seoul ranked ninth with 121.
Completing the global top ten was Tokyo, which hosted 119 international association meetings in 2025. The result reinforces Tokyo’s position as one of the world’s leading destinations for international conferences and association meetings.
Looking Beyond Volume: The Importance of Destination Specialization
While overall meeting volume remains an important indicator, the rankings also reveal the significance of destination specialization and sector expertise.
For example, Dublin ranked 18th overall, yet placed among the global top ten in both the medical and scientific meeting categories. This performance reflects the strength of Ireland’s life sciences research ecosystem and its ability to attract knowledge-driven international events.
Similarly, Taipei ranked 23rd in overall meeting volume but achieved top-15 positions across all three major categories of medicine, science, and technology. The result highlights Taipei’s balanced strength across multiple high-value knowledge sectors.
In Canada, Montreal ranked sixth globally in technology-related meetings, further strengthening its reputation as a leading innovation hub. Meanwhile, Porto stands out for its performance in scientific meetings, ranking ninth worldwide despite a comparatively smaller overall meeting volume.
These examples illustrate an important trend within the global meetings industry: competitiveness is increasingly measured not only by the number of meetings hosted, but also by a destination’s ability to attract conferences in strategically important fields. Strong academic institutions, research capabilities, industry clusters, and innovation ecosystems are becoming key factors in international meeting destination competitiveness.
Strategic Venue Development and Infrastructure Investment as Competitive Advantages for Cities
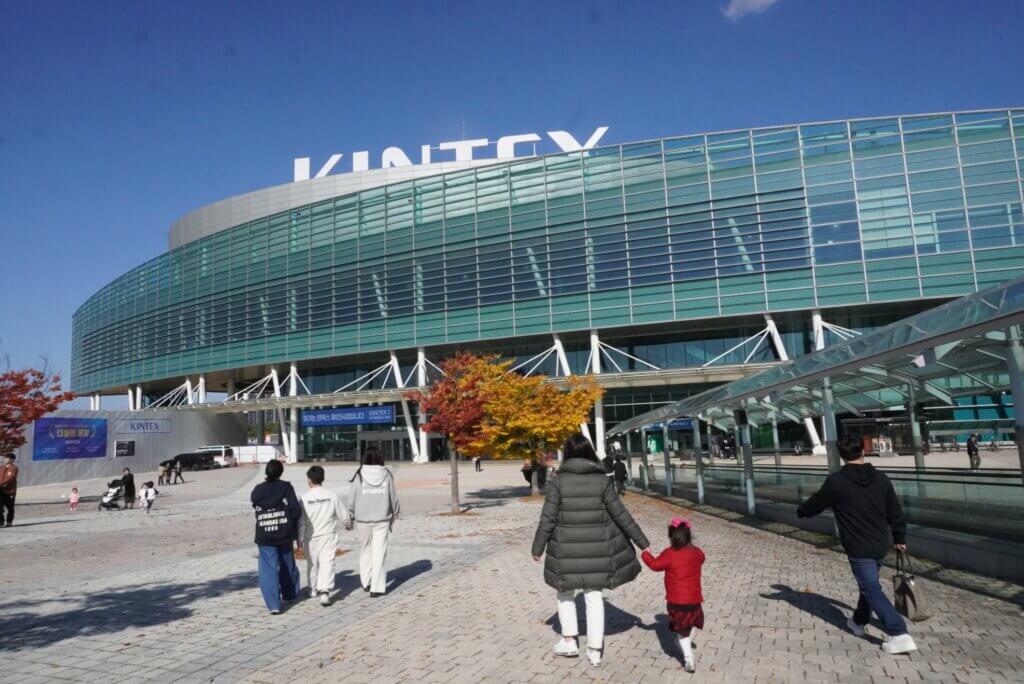
The quality and scale of venue infrastructure play a critical role in the success of international meetings and conferences. Convention centers and exhibition facilities serve as strategic foundations for cities competing in the global meetings market. Cities such as Barcelona, Dubai, Seoul, and Vancouver have invested heavily in convention infrastructure with a long-term vision extending across generations.
Purpose-built convention and exhibition venues enable destinations to attract a greater number of international events, encourage longer participant stays, and generate economic benefits that extend across multiple sectors of the local economy.
Major Convention Facility Projects Continue Worldwide
A broader global trend is also emerging. Countries including Saudi Arabia, India, China, and United States are investing billions of dollars in the development of next-generation convention centers, often supported by national or regional governments.
More than 75 major venue construction and expansion projects are currently underway across 36 countries, representing total investments exceeding US$30 billion. These projects are not simply about constructing new buildings. Rather, they represent long-term investments in the infrastructure that will support future knowledge exchange, innovation, international collaboration, and economic development.
Sustainability Emerges as a Key Competitive Differentiator
The requirements placed on meeting venues are evolving rapidly. Flexibility has become an essential element of modern venue design. New facilities such as the latest expansion at Fira Barcelona demonstrate this trend, offering vast column-free spaces capable of accommodating everything from large plenary sessions to smaller breakout meetings without disrupting the flow of a program.
At the same time, sustainability has become an increasingly important competitive differentiator. Examples such as the Melbourne Convention and Exhibition Centre in Australia achieving a six-star environmental rating, convention facilities in Costa Rica implementing their own carbon standards, and convention venues in Vancouver, Canada obtaining multiple platinum-level certifications demonstrate that environmental performance is becoming closely linked to business competitiveness and destination attractiveness.
Universities Host More Than One-Third of International Meetings
The role of universities in the meetings industry should not be overlooked. According to ICCA data, 36% of all meetings are held at university facilities, exceeding both hotels (28%) and convention centers (27%).
Cities such as Edinburgh in the United Kingdom, Leiden in the Netherlands, Leuven in Belgium, Lyon in France, and Cambridge in the United Kingdom have successfully leveraged the academic reputation of their universities to attract international meetings. Strong medical schools help attract healthcare-related conferences, while leading engineering faculties often serve as magnets for technical and scientific associations.
In many cases, a destination’s competitiveness is built upon its academic reputation. This is further supported by ICCA data showing that 59% of association meeting ambassadors are affiliated with universities. Destinations that position universities as strategic partners are likely to gain an increasing advantage in attracting international association meetings in the years ahead.
Sustainability and Climate Resilience Become Critical Factors in Destination Selection
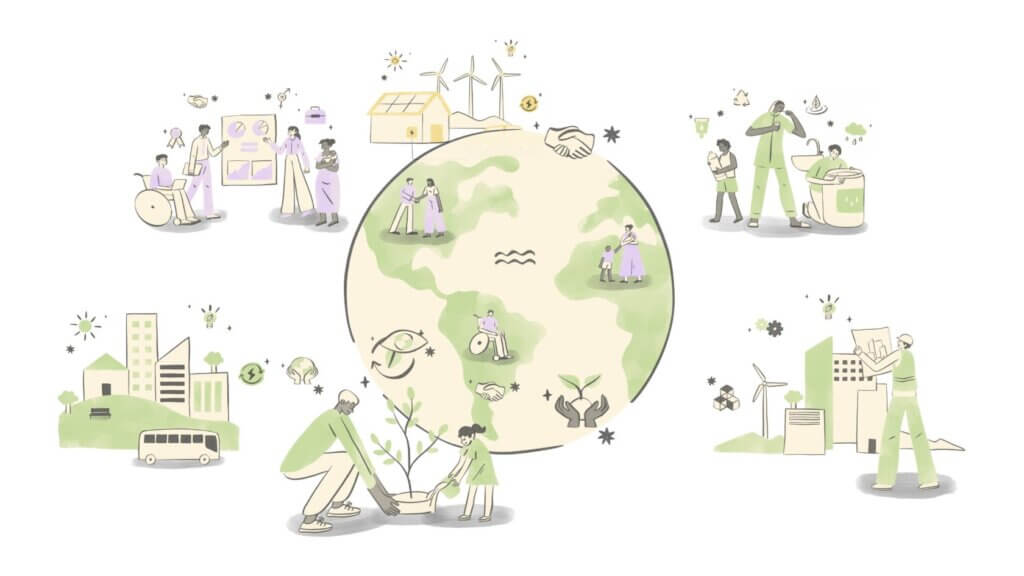
Environmental responsibility and sustainability are playing an increasingly influential role in destination decision-making.
Recent research shows that 66% of associations consider sustainability to be either very important or extremely important when planning meetings and events, up from 60% in 2023. Many organizations are now incorporating sustainability considerations into event planning processes and long-term strategic frameworks.
However, a significant gap remains between awareness and implementation. Only 12% of associations currently publish sustainability initiatives in their annual reports. Furthermore, just 24% include specific sustainability criteria within their requests for proposals (RFPs) when selecting host destinations and venues.
As a result, destinations and venues capable of presenting measurable sustainability solutions are likely to gain a significant competitive advantage in the future.
Extreme Weather Creates New Expectations for Host Destinations
Alongside sustainability, climate resilience is becoming an increasingly important consideration.
Between 2004 and 2024, a total of 2,091 events worldwide were disrupted by extreme weather incidents. In 2025 alone, 55 weather-related disasters causing more than US$1 billion in damages were recorded, significantly exceeding the historical annual average of nine such events.
In the United States, the average interval between billion-dollar weather disasters has shortened dramatically, from 82 days during the 1980s to just 19 days over the past decade.
Against this backdrop, destination resilience and preparedness have become essential requirements for attracting international meetings. Cities that can demonstrate clear contingency plans for extreme weather events, rapid recovery capabilities, and effective communication systems for participants are increasingly viewed as preferred destinations.
Venues with proven environmental credentials may also offer economic advantages. By improving energy efficiency and reducing waste management costs, sustainable facilities can deliver both environmental and financial benefits for event organizers and host destinations alike.
Sources of Competitiveness and Regional Trends Across Asia-Pacific
The Asia-Pacific region continues to strengthen its position within the global international meetings industry, supported by an increasingly interconnected network of destinations and sustained growth in meeting activity.
Between 2023 and 2025, the number of international association meetings held across the region increased by 33%, further solidifying Asia-Pacific’s position as the world’s second-largest meetings market. This growth reflects both the recovery of international travel and the region’s expanding role in global knowledge exchange, research collaboration, and business connectivity.
The region is also strongly represented in the global rankings. Fourteen countries and territories from Asia-Pacific were included in the world’s top 50 country rankings, while 14 cities secured positions within the global top 50 city rankings. Together, these destinations account for approximately 30% of all ranked countries and cities worldwide.

Japan Leads the Asia-Pacific Rankings by a Significant Margin
In the Asia-Pacific country rankings, Japan secured a commanding lead with 491 international association meetings, making it the region’s highest-ranked destination by a considerable margin.
China ranked second with 326 meetings, followed by South Korea in third place with 286. Australia placed fourth with 241 meetings, while Thailand completed the top five with 171.
India ranked sixth with 158 meetings, narrowly ahead of Singapore, which hosted 156 meetings and placed seventh. Malaysia ranked eighth with 143 meetings, followed by Taiwan with 137 and Indonesia with 110. The remainder of the regional top 15 included Hong Kong, New Zealand, Vietnam, the Philippines, and Macao.
The rankings demonstrate both the diversity and growing depth of the Asia-Pacific meetings market. While Japan, China, and South Korea continue to serve as the region’s largest meeting destinations, emerging markets across Southeast Asia are steadily increasing their presence in the international association meetings sector.
Singapore Leads the Asia-Pacific City Rankings, Followed by Seoul and Tokyo; Kyoto Enters the Top 10
City Ranking
| Rank | City | Country/Territory | Meetings |
|---|---|---|---|
| 1 | Singapore | Singapore | 156 |
| 2 | Seoul | South Korea | 121 |
| 3 | Tokyo | Japan | 119 |
| 4 | Bangkok | Thailand | 118 |
| 5 | Hong Kong | Hong Kong | 102 |
| 6 | Taipei | Taiwan | 89 |
| 7 | Kuala Lumpur | Malaysia | 73 |
| 8 | Sydney | Australia | 62 |
| 9 | Shanghai | China | 57 |
| 10 | Kyoto | Japan | 53 |
| 11 | Beijing | China | 51 |
| 12 | Brisbane | Australia | 50 |
| 12 | Busan | South Korea | 50 |
| 14 | Bali | Indonesia | 48 |
| 15 | Macao | Macao | 47 |
| 16 | Melbourne | Australia | 45 |
| 17 | Manila | Philippines | 38 |
| 18 | New Delhi | India | 36 |
| 19 | Osaka | Japan | 35 |
| 20 | Hangzhou | China | 27 |
| 20 | Ho Chi Minh City | Vietnam | 27 |
Looking at the Asia-Pacific city rankings, Singapore took first place with 156 international association meetings. Seoul ranked second with 121 meetings, followed closely by Tokyo in third place with 119. Bangkok ranked fourth with 118 meetings, while Hong Kong completed the top five with 102. Taipei placed sixth with 89 meetings, followed by Kuala Lumpur with 73 and Sydney with 62. Shanghai ranked ninth with 57 meetings, while Kyoto secured tenth place with 53. Just outside the top 10 are several highly competitive destinations, including Beijing, Brisbane, Busan, Bali, Macao, and Melbourne, illustrating the depth and diversity of the region’s meetings industry.
What Makes Asia-Pacific Unique?
One of the defining characteristics of the Asia-Pacific region is the coexistence of highly developed economies and rapidly expanding emerging markets, all connected through increasingly integrated networks of trade, innovation, research, and knowledge exchange.
The region combines East Asia’s advanced research and technology ecosystems, Southeast Asia’s growing digital and engineering capabilities, and South Asia’s scale and transformative economic development. Together, these factors create an environment where expertise from a wide range of fields—including artificial intelligence, medical science, environmental management, and agricultural systems—can intersect and generate new opportunities for collaboration.
Another distinctive strength of the region is the active involvement of policymakers in international meetings and conferences. Across many Asia-Pacific destinations, governments increasingly view international association meetings as platforms for connecting national policy priorities with global expertise, research, and innovation.
Rather than serving solely as venues for professional exchange, international meetings are often positioned as strategic tools that support long-term economic development, international partnerships, and knowledge-based growth. This alignment between public policy objectives and international meeting activity has become one of the region’s most significant competitive advantages.

Matsue Records Its Highest-Ever Total with 14 International Meetings, Matching Much Larger Cities.
International Meetings Are Held Across a Wide Range of Japanese Cities
Japan Rankings (Top 20 Cities)
| National Rank | City | Meetings | Asia-Pacific Rank | Global Rank |
|---|---|---|---|---|
| 1 | Tokyo | 119 | 3 | 10 |
| 2 | Kyoto | 53 | 10 | 46 |
| 3 | Osaka | 35 | 19 | 80 |
| 4 | Sapporo | 24 | 23 | 112 |
| 5 | Fukuoka | 23 | 25 | 116 |
| 5 | Yokohama | 23 | 25 | 116 |
| 7 | Kitakyushu | 16 | 38 | 167 |
| 8 | Kobe | 15 | 41 | 184 |
| 9 | Matsue | 14 | 44 | 198 |
| 10 | Sendai | 11 | 57 | 239 |
| 11 | Nara | 10 | 58 | 254 |
| 12 | Kanazawa | 9 | 63 | 280 |
| 12 | Tsukuba | 9 | 63 | 280 |
| 14 | Nagoya | 7 | 75 | 339 |
| 15 | Hiroshima | 6 | 79 | 369 |
| 16 | Kagoshima | 5 | 85 | 404 |
| 16 | Kumamoto | 5 | 85 | 404 |
| 16 | Onna Village | 5 | 85 | 404 |
| 16 | Takamatsu | 5 | 85 | 404 |
| 20 | Chiba | 4 | 94 | 473 |
| 20 | Kashiwa | 4 | 94 | 473 |
| 20 | Okayama | 4 | 94 | 473 |
| 20 | Uji | 4 | 94 | 473 |
Japan ranks first in the Asia-Pacific country rankings and sixth globally, a position supported not only by its major metropolitan areas but also by the remarkable breadth of destinations hosting international association meetings across the country.
Rather than concentrating meetings in a small number of gateway cities, Japan benefits from a diverse network of destinations that leverage their academic strengths, industry expertise, cultural assets, and regional identities to attract international events. This nationwide distribution has become one of the key foundations of Japan’s competitiveness in the global meetings market.
A closer look at the Asia-Pacific city rankings illustrates the depth of Japan’s meetings ecosystem. In 2025, Tokyo hosted 119 international association meetings, followed by Kyoto with 53 and Osaka with 35. Other leading destinations included Sapporo (24), Fukuoka (23), Yokohama (23), Kitakyushu (16), Kobe (15), Matsue (14), and Sendai (11).
Additional destinations included Nara (10), Kanazawa (9), Tsukuba (9), Nagoya (7), Hiroshima (6), Kagoshima (5), Kumamoto (5), Onna Village (5), Chiba (4), Kashiwa (4), Okayama (4), and Uji (4).
The breadth of destinations extends even further. Cities including Fukui, Ginowan, Hachioji, Nagasaki, and Toyama each hosted three international meetings. Meanwhile, destinations such as Awaji, Gotemba, Hakodate, Karuizawa, Matsuyama, Miyazaki, Morioka, Nagano, Naha, Numazu, Shizuoka, Tachikawa, Utsunomiya, and Yamagata each recorded two meetings.
A further group of destinations hosted one international meeting during the year, including Beppu, Fukushima, Fukuyama, Gifu, Hamamatsu, Hayama, Himeji, Hirosaki, Ichikawa, Ise-Shima, Ishigaki, Kamakura, Kawasaki, Mito, Miyakojima, Niigata, Obihiro, Oita, Otsu, Suita, Toyota, Tsu, and many others.
From Hokkaido in the north to Okinawa in the south, few countries can match the geographic breadth of Japan’s international meetings landscape. The rankings demonstrate that Japan’s strength lies not only in its largest cities, but also in the ability of regional destinations to participate in global knowledge exchange and attract international communities.
※The discrepancy may be attributable to incomplete registration data, multi-city events, hybrid meeting formats, or other special event classifications that could not be assigned to a single destination in the published dataset.
Prefecture-Level View Highlights the Strength of Regional Destinations
| Rank | Prefecture | Meetings | Cities and Breakdown |
|---|---|---|---|
| 1 | Tokyo | 125 | Tokyo (119), Hachioji (3), Tachikawa (2), Koganei (1) |
| 2 | Kyoto Prefecture | 57 | Kyoto (53), Uji (4) |
| 3 | Fukuoka Prefecture | 39 | Fukuoka (23), Kitakyushu (16) |
| 4 | Osaka Prefecture | 36 | Osaka (35), Suita (1) |
| 5 | Hokkaido | 27 | Sapporo (24), Hakodate (2), Obihiro (1) |
| 6 | Kanagawa Prefecture | 26 | Yokohama (23), Kawasaki (1), Kamakura (1), Hayama (1) |
| 7 | Hyogo Prefecture | 18 | Kobe (15), Awaji (2), Himeji (1) |
| 8 | Shimane Prefecture | 14 | Matsue (14) |
| 9 | Okinawa Prefecture | 13 | Onna Village (5), Ginowan (3), Naha (2), Okinawa City (1), Ishigaki (1), Miyakojima (1) |
| 10 | Chiba Prefecture | 12 | Chiba (4), Kashiwa (4), Ichikawa (1), Noda (1), Urayasu (1), Katsuura (1) |
When the figures are aggregated at the prefectural level, a different perspective emerges. Fukuoka Prefecture ranked third nationally with a combined total of 39 international association meetings across two cities, Fukuoka and Kitakyushu. Okinawa Prefecture and Chiba Prefecture also ranked among the top-performing prefectures, benefiting from meetings being hosted across multiple destinations rather than concentrated in a single city.
Top 10 Asia-Pacific Countries by Number of Cities Hosting International Association Meetings
| Rank | Country/Territory | Number of Cities Hosting Meetings | Meetings (Reference) |
|---|---|---|---|
| 1 | Japan | 77 | 491 |
| 2 | China | 49 | 326 |
| 3 | India | 31 | 158 |
| 4 | South Korea | 26 | 286 |
| 5 | Australia | 20 | 241 |
| 6 | Thailand | 18 | 171 |
| 7 | Indonesia | 17 | 110 |
| 7 | Malaysia | 17 | 143 |
| 9 | Taiwan | 14 | 137 |
| 10 | New Zealand | 12 | 73 |
The rankings reveal the success of Japan’s highly decentralized approach to hosting international association meetings. Japan not only leads the Asia-Pacific region in total meetings but also far surpasses other destinations in the number of cities hosting them, with 77 cities recording at least one international association meeting in 2025.
This breadth reflects the strength of Japan’s nationwide network of universities, research institutions, convention facilities, and local stakeholders. International meetings are not confined to a handful of major metropolitan areas; instead, regional destinations across the country are directly connected to global academic and professional communities.
China and India also demonstrate increasingly multi-centered growth patterns. Supported by vast geographic scale and rapid economic development, both countries are seeing international meetings expand beyond their primary gateway cities into a growing number of regional destinations.
The expansion of meeting activity across Southeast Asia is equally noteworthy. While Singapore continues to attract a large volume of meetings, countries such as Thailand and Indonesia are steadily broadening their destination portfolios by developing additional host cities. The data suggests that international meetings are increasingly being distributed across a wider range of urban centers throughout the region rather than remaining concentrated in a small number of major cities.
※The ranking of cities hosting at least one international association meeting was compiled independently by the MICE TIMES ONLINE editorial team based on ICCA data.
Japan’s Strength by Sector: Ranked Second Globally in Technology Meetings
A sector-based analysis highlights Japan’s competitive strengths in knowledge-intensive fields.
Tokyo, Osaka, and Yokohama collectively host a significant number of technology-related association meetings, helping Japan achieve the world’s second-highest ranking in the technology category, behind only the United States. Japan also ranks third globally in scientific meetings and seventh in medical meetings.
These results demonstrate the country’s ability to attract conferences in highly specialized fields that are closely linked to research, innovation, and industrial development. The data suggests that Japan’s universities, research institutes, and industry clusters are functioning effectively as magnets for researchers, engineers, scientists, and industry leaders from around the world.
Rather than relying solely on tourism appeal or venue capacity, Japan’s competitiveness is increasingly rooted in the depth of its knowledge ecosystem and its ability to facilitate international collaboration.
MICE as a Strategic Tool for Attracting and Developing Global Talent
International meetings play a role that extends far beyond tourism and economic impact. They have become a strategic mechanism for internationalization, talent attraction, and knowledge exchange.
Global mobility among highly skilled professionals has become increasingly challenging due to visa barriers, geopolitical uncertainty, and shifting economic conditions. Recent data indicates that the movement of skilled professionals declined by 8.5% year-on-year, representing approximately 220,000 fewer international relocations.
In an era when talent cannot always move freely across borders, destinations are increasingly adopting a different approach: bringing the world to their cities through international meetings and conferences.
International meetings support talent development through four important stages.
The first stage provides students and early-career researchers with direct exposure to the latest developments in their fields. The second enables them to build lasting relationships with peers, mentors, and future collaborators from around the world.
The third stage occurs when established researchers, academics, and industry experts experience a destination’s academic or industrial environment firsthand and begin to consider it as a potential location for future research, collaboration, or investment activities.
The fourth stage represents perhaps the most valuable long-term outcome. Local talent gains international visibility through participation in global meetings, while remaining connected to their home institutions and communities. This creates a virtuous cycle in which globally recognized experts continue to contribute locally while helping develop the next generation of talent.
Viewed through this lens, international meetings are not merely events. They function as long-term investments in human capital, innovation ecosystems, and the global competitiveness of cities and nations.

Rwanda’s Example: How Kigali Rose to Become Africa’s Second-Ranked Meeting Destination
The experience of Kigali provides a compelling example of how strategic investment and long-term vision can transform a destination’s position within the international meetings industry.
When Rwanda joined ICCA in 2014, it ranked only 13th among African countries in terms of international meetings activity, generating approximately US$29.6 million in meeting-related revenue. Over the following decade, however, the country pursued a deliberate strategy centered on convention infrastructure development, international engagement, and destination promotion.
Significant investment in facilities such as the Kigali Convention Centre helped strengthen the country’s ability to host large-scale international events. Rwanda subsequently welcomed major gatherings including the World Economic Forum, the Commonwealth Heads of Government Meeting, and meetings organized by FIFA, successfully hosting events that attracted thousands of participants.
As a result, Kigali has emerged as Africa’s second-ranked city for international meetings. The city’s growth demonstrates how targeted investment, strong government support, and a clear international positioning strategy can elevate a destination’s profile within the global meetings market.
The momentum is set to continue. Kigali has been selected to host the 66th ICCA Congress in 2027, marking the return of ICCA’s flagship global event to Africa for the first time in two decades. The achievement reflects Rwanda’s success in building international credibility and establishing itself as a hub for knowledge exchange, business collaboration, and global connectivity.
What the Latest Data Tells Us About the Future of MICE
The 2025 ICCA rankings provide valuable insights into both the current state and future direction of the global meetings industry.
The data highlights Japan’s strong position within the international meetings landscape, supported by an extensive network of destinations across the country. Regional cities, universities, research institutions, and industry clusters collectively contribute to a nationwide ecosystem that attracts international meetings and facilitates global knowledge exchange. Japan’s particularly strong performance in technology and scientific meetings further underscores its role as a leading destination for knowledge-intensive events.
At the same time, the industry continues to face new challenges. Sustainability considerations are becoming increasingly important in destination selection, while extreme weather events and climate-related risks are reshaping how organizers evaluate venues and host cities.
Against this backdrop, international meetings remain at the forefront of change within the MICE industry. Beyond their immediate economic impact, they contribute to destination branding, talent attraction, innovation, research collaboration, and long-term economic development.
For destinations seeking to strengthen their competitiveness, the ability to interpret industry data, identify emerging trends, and develop clear long-term strategies will become increasingly important. As the global meetings industry continues to evolve, those destinations that align infrastructure investment, knowledge assets, sustainability goals, and international engagement strategies will be best positioned for future success.
-
Mexico City World Cup 2026: What the Opening Day Revealed About Mega Event Management and Global Business Success

-
What Is GREEN×EXPO 2027? Dates, Venue, Highlights, and Exhibitor Information for the International Horticultural Expo in Yokohama, Japan